Submitted by Anju George
Visualizing Density: a project by the Canadian Urban Institute in the GGH Area
Canada Architecture News - Jan 02, 2021 - 12:34 11115 views
Edward T. McMahon, Senior Resident Fellow for Sustainable Development at Urban Land Institute, once said, “Growth is inevitable and desirable, but destruction of community character is not. The question is not whether your part of the world is going to change. The question is how.”
To understand what Canadian Urban Institute (CUI) was doing towards the project "Visualizing Density", all of us as "engaged" citizens need to firstly understand the very meaning of density and what it encompasses. This pilot project was undertaken by CUI to inform planning and design professionals about the way new communities need to be designed, keeping the principles of complete communities in mind. It is not enough that resources are provided for new neighbourhoods to be designed responsibly; resources should also be made available for existing communities to be transformed, so that they conform seamlessly to the characteristics of sustainable community design.
Five unique case studies were conducted by CUI in the Greater Golden Horseshoe (GGH) area to get a clear understanding of the neighbourhood built form in connection with density targets laid out in the Provincial Growth Plan. Density, a substantive metric when it comes to assessing how municipalities and regions in the GGH are planning to achieve the goals laid down by the Growth Plan, was tabulated here with respect to people and jobs per hectare at the neighbourhood and block scales. One might ask, "What makes a community complete?" This question was methodically answered considering the six key characteristics that drive complete communities; namely, walkability, diversity, green and open spaces, amenities, transit and design.
This project was aimed at bringing about benefits in the long run, in that it was not only meant to inform people who are currently involved in the market; it was also meant to contribute and translate to public policy for managing growth and structuring successful communities in the Golden Horseshoe Area, in the years to come. ‘Visualizing Density’ strove to ascertain whether greater density was in fact a workable proposition in the GGH area. A steady upward population growth over the next 15 years in the GGH coalesced with provincial land use plans, translates to 12 million persons living and working in the same land area, that is currently only occupied by 9 million people. The only way in which everyone can be accommodated smoothly is by planning towards denser, more compact, sustainable developments. The Provincial Growth Plan, as a policy tool, should require existing and future developments to conform to more stringent compact measures; by maintaining the efficiency of existing infrastructure, preserving and protecting natural areas and farmlands, and seeing to it that drinking water is kept both safe and accessible.
Because of rising land costs, diverse family demographics and rising populations, the real estate market has also been changing their mindset towards constructing more townhouses, condo towers and mid-rise apartments. The focus is being taken away from the private automobile, and there is a deep shift towards designing around people and active transportation. There is significant research that explains how the increase in density beyond a certain level brings about a decrease in the use of the automobile, thereby favouring public transit, walking and cycling1.
Higher density doesn’t necessarily have to carry a negative connotation. Overcrowding and congestion are, in fact, examples of inefficient planning and design. Intensification, on the other hand, can occur through the optimal usage of land, thereby reducing carbon footprints and enhancing community identities, apart from the myriad other benefits such as improved health and improved sustainability. Smart design and appropriate zoning measures can introduce non-intrusive densities. With the revamping of California’s revamped Density Bill for housing (which has yet to pass the Senate), there is definitely talk on how denser neighbourhoods make for better communities in North America2. Density evolves over time as individual and familial circumstances change. The case in point here is that the needs of residents are provided for through different stages of their lives by revisiting density metrics.
What does density encompass?
The Growth Plan plans to leverage growth management. It also intends on protecting food supply and water by fostering change in the built environment in the GGH, apart from laying measures to hold the urban edge. With this at the forefront, the Growth Plan aims to:
• Revitalize downtowns that transform into vibrant centres (25 urban growth centres);
• Introduce complete communities that are conducive to living, working, shopping and playing;
• Bring about substantive choices in housing types to meet every individual’s needs;
• Limit sprawl and protect green areas including farmland;
• Reduce traffic congestion by providing access to a range of transportation choices (like transit, cycling and walking)
Density targets are key performance measures. The Growth Plan tabulates density to be the ratio of residents (and jobs) to a certain land area. After careful deliberation, the province has come about with density targets of 50, 150, 200 and 400 residents and jobs per hectare, that municipalities and regions have to be in accordance with as per their Official Plans - in order for the municipalities and regions to measure how growing number of persons are accommodated in a fixed amount of space.
The other pertinent theme associated with density is the sheer importance of good design that is able to both, achieve healthy density targets and create a complete diverse community that supports inclusivity. Well-designed communities contain a mix of housing types that provide for the needs of residents at all stages of their lives. Whilst it is standard for professionals in the field of design to consider urban density, there is almost always no consideration of how individuals might perceive such density3. Perceived density becomes an obstacle to how people determine densities, as landscaping, aesthetics, noise, visibility and building type largely influence perceived density. Weighted density should slowly become the norm of how density, residential or other, is conceived. Zoning regulations that allow for a mix and variety of building types are probable to attain both density targets and engender the diversity and walkability that creates inclusive, complete communities.
Planning for density (co-efficient of residents and/or jobs/unit or area) is a whole different exercise when compared to measuring density (residents and jobs/land area). Density calculations employed in these case studies estimated actual population on the ground (at the time the census or employment study was conducted) to the land area. On the other hand, when municipalities plan for density, they calculate density adopting the persons per unit (PPU) measure, for residential, and persons per sq.ft., for commercial areas. This brings to light the fact that buildings go through many evolutionary cycles of use, thereby giving rise to a potential for changed population or employment counts because of vacancies or levels of economic activity.
In the case studies discussed here, density was measured at the neighbourhood and block scales. Density is a parameter that varies largely due to the scale or base land area used in density calculations. Therefore, parcel or site densities are almost always greater than neighbourhood densities, because lands that are undeveloped (like parks and roads, etc.), are counted towards base land area calculations when neighbourhood densities are calculated. Land areas that are excluded from density calculations, like the undeveloped areas discussed above, are known as ‘take-outs’. The very significance of take-outs varies between provinces and municipalities; all the same, they hold great importance from a compliance point of view.
Take-outs
The Growth Plan refers to net-outs or take-outs as specific non-developable areas that must be excluded from density calculations. These include: “features that are both identified in any applicable official plan or provincial plan, and where the applicable provincial plan or policy statement prohibits development within the features, including: wetlands, coastal wetlands, woodlands, valley lands, areas of natural and scientific interest, habitat of endangered species and threatened species, wildlife habitat, and fish habitat4”.
The 2006 definition for net-outs was employed and the Land Information Ontario Open Data catalogue’s open data was utilized to deduce those areas, and, as a result, the areas were removed from the density calculations.
Methodology
A fair number of studies have been referenced such as the Lincoln Land Institute Visualizing Density, the Waterloo Report Visualizing Densities Part One and Part Two, and Urban Strategies’ Citizen's Guide to Density. This was essentially done to arrive at the answer to the overarching research question, “What do the density targets in the Growth Plan look like in existing communities?” Creating a replicable methodology that measured density at the neighbourhood or community scale was also a part of the agenda.
Two observations emerged from the analysis.
1) Density is but an inevitable part and parcel of how we want to build self-sufficient communities. GGH is projected to grow by leaps and bounds, by more than 3 million people, by 2031. This growth can efficiently be managed by planning for more compact and denser communities, while making good use of existing infrastructure, preserving nature and protecting potable water and farmland.
2) The creation of complete communities, where persons can live, work and play, is the need of the hour. Neighbourhood characteristics or ‘drivers’ that work with density, influence the design of such communities. There are six drivers, namely, walkability, diversity, green and open spaces, amenities, transit and design.
Data Collection in Complete Communities
Easily accessible data and statistics that could be analyzed via mapping and photos, informed how measures of complete communities were to be identified. Images using drone photography, and applications like Google Earth and Google Street View, were made use of to identify each of the drivers showcased in the 5 communities.
Amenities, Parks and Commercial Space: Open Data portals were explored for locational data of schools, daycare and community centres, and municipal parks. Wherever there seemed to be a gap in data, Google Earth location search was adopted to visually map out the amenities within a 400 metre radius of the community boundary.
Transit Stops: Municipalities’ Open Data portals provided General Transit Feed Specification (GTFS) data.
![]() Identification of Transit Points in Barrel Yards. Image © CUI.
Identification of Transit Points in Barrel Yards. Image © CUI.
Case Studies
The five case studies in the GGH that were introduced earlier are: Carlaw and Dundas, Toronto.
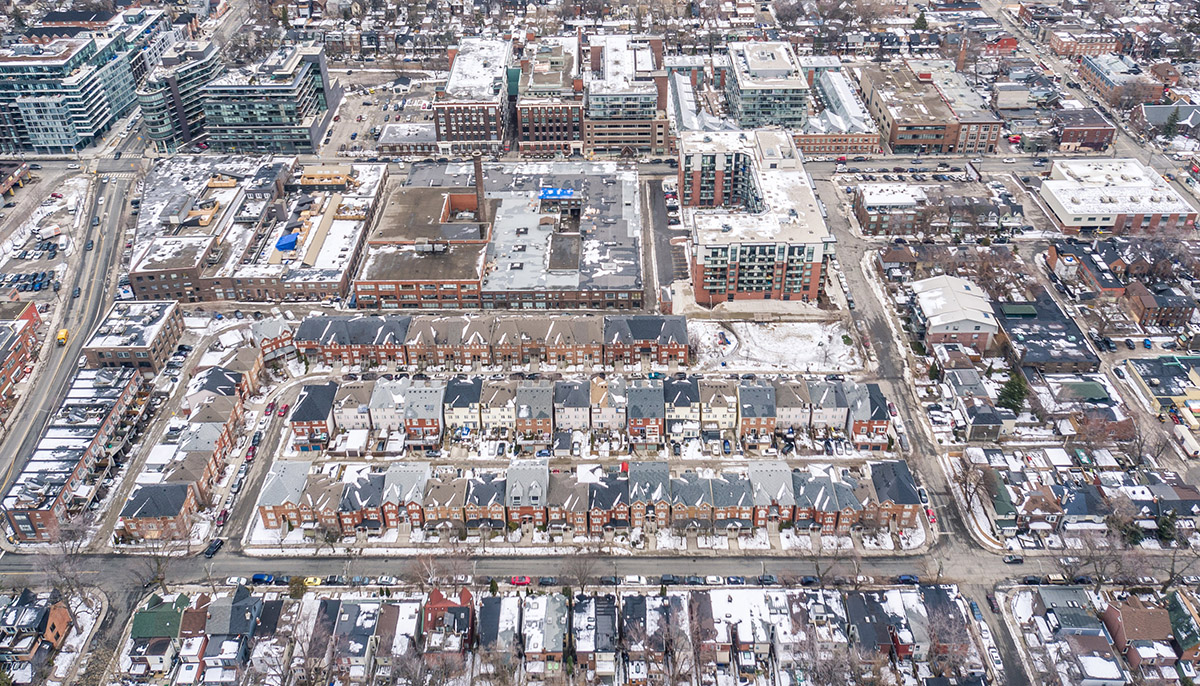 Carlaw and Dundas situated in Toronto's East End. Image © CUI.
Uptown Core, Oakville
 Uptown Core in Central Oakville. Image © CUI.
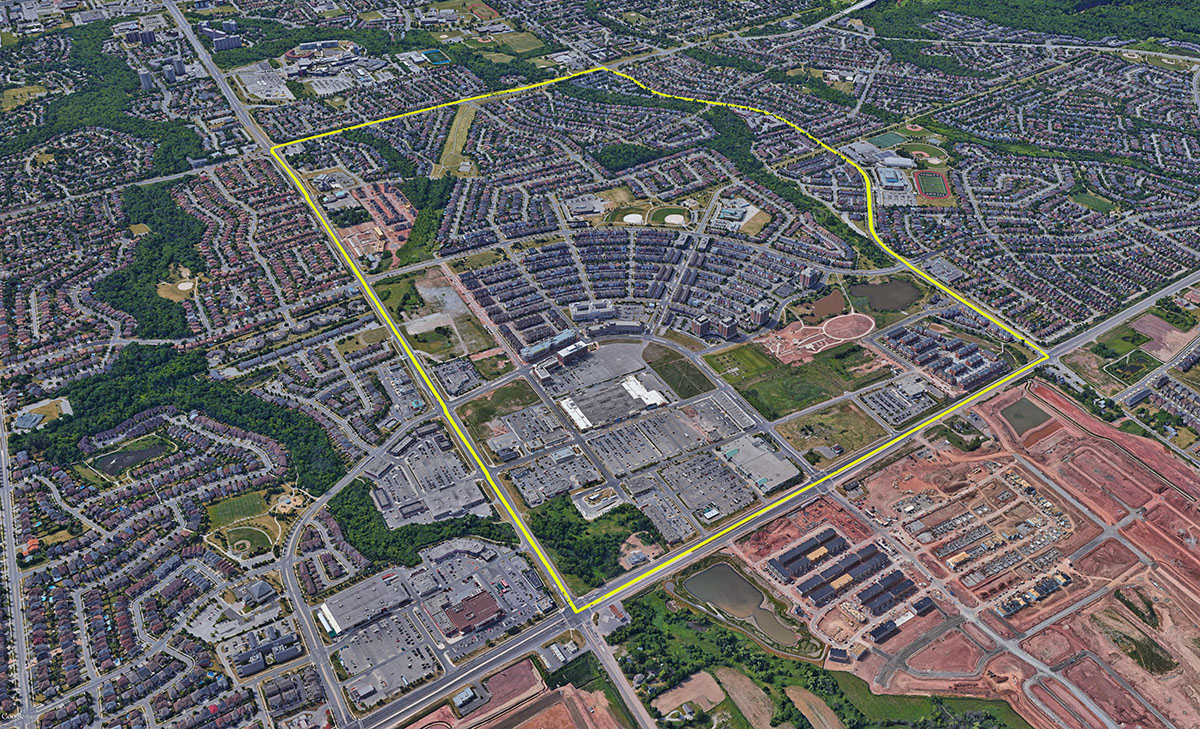 Siting of Central Oakville's Uptown Core. Image © CUI.
Downtown Burlington
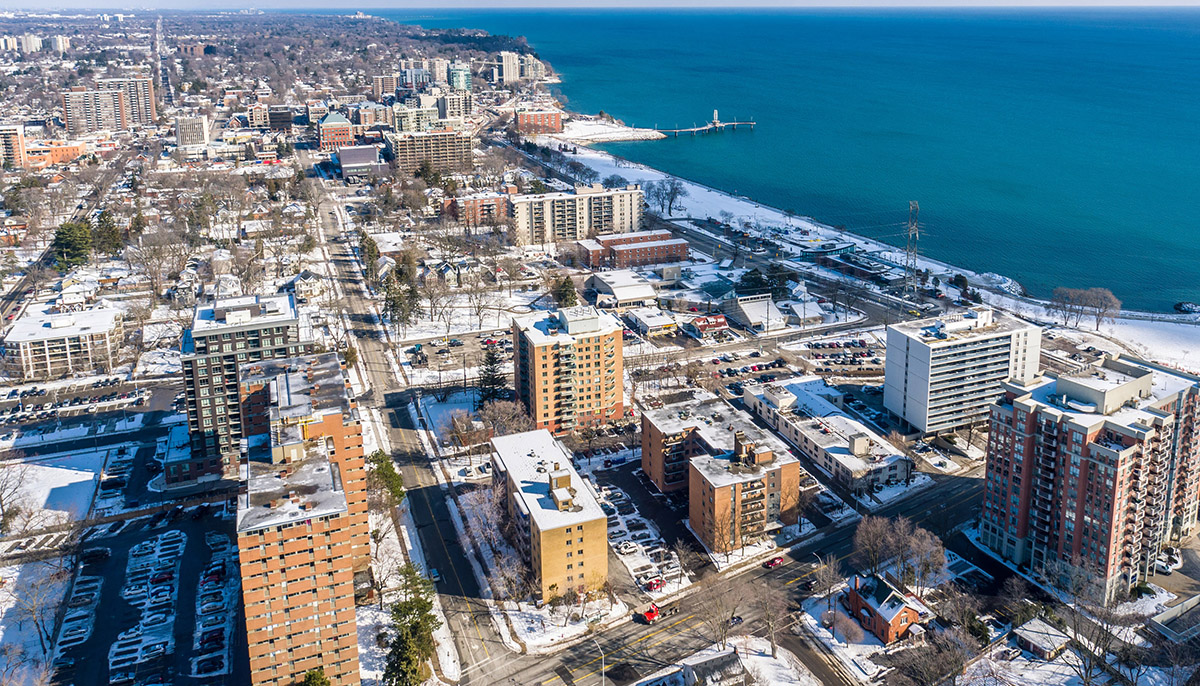 Downtown Burlington along Lake Ontario. Image © CUI.
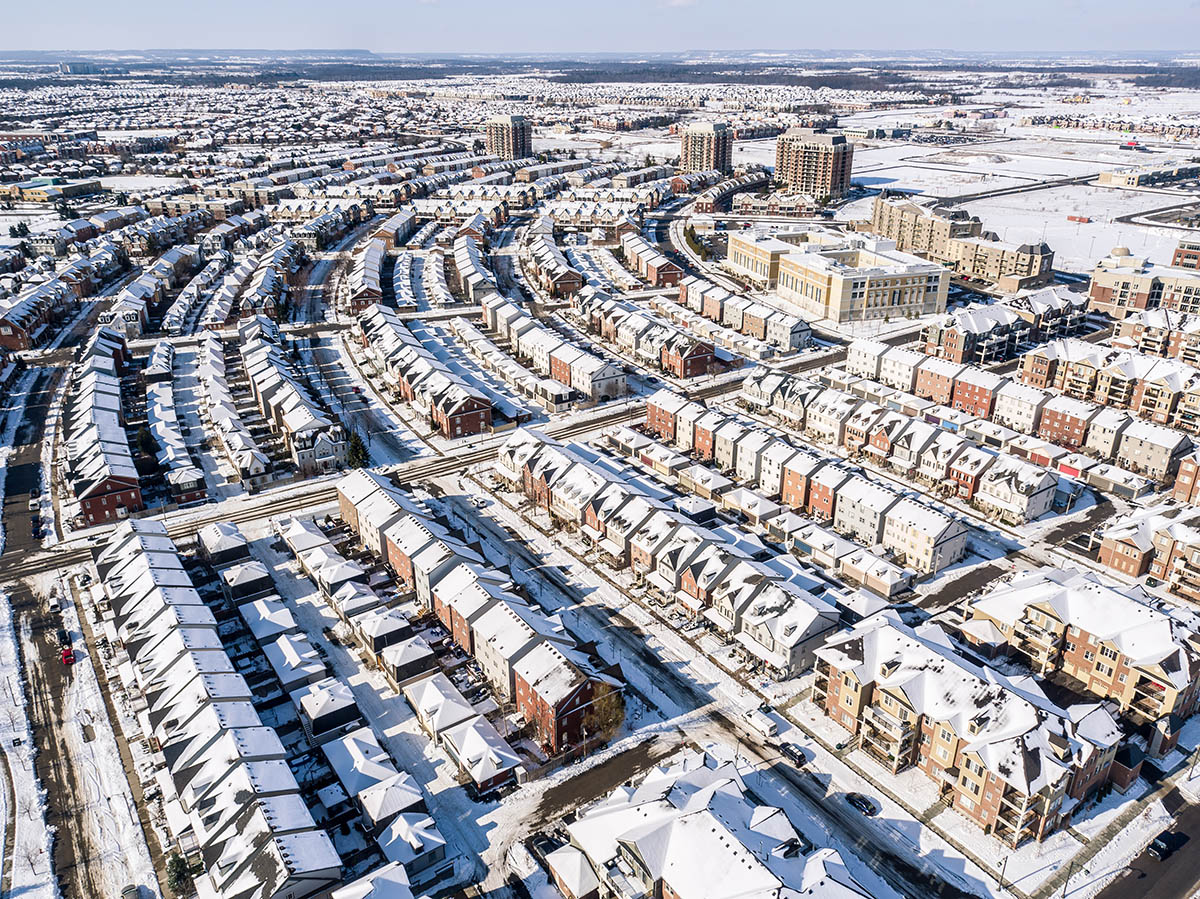
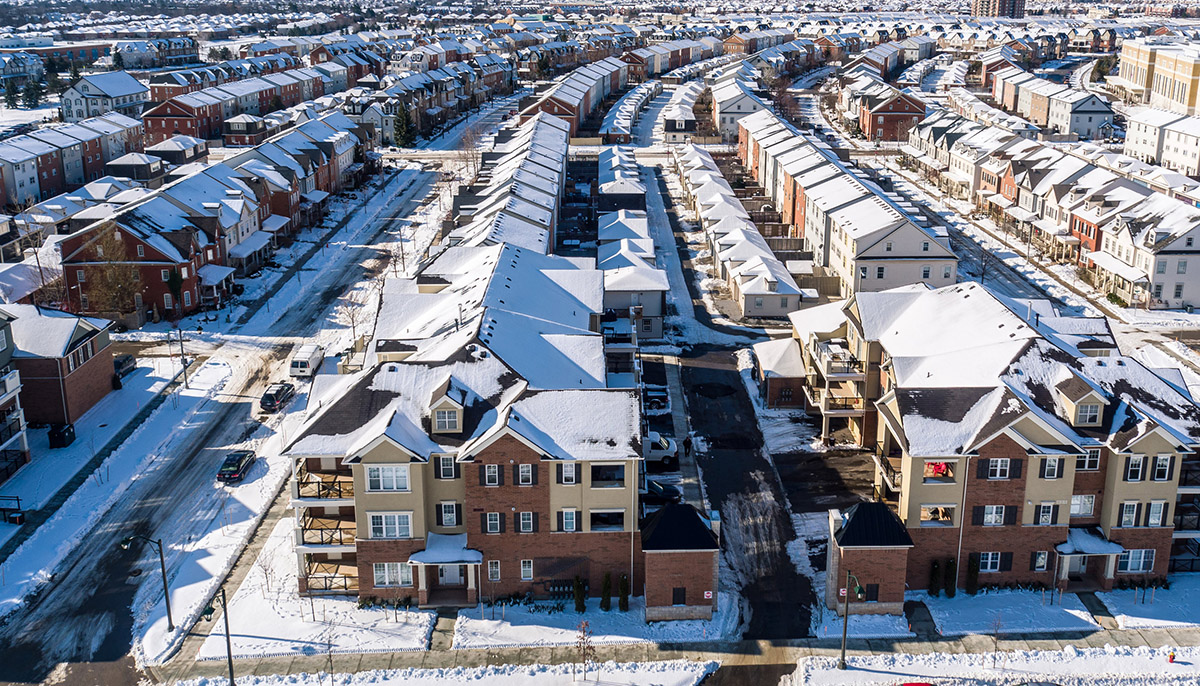
Cornell, Markham
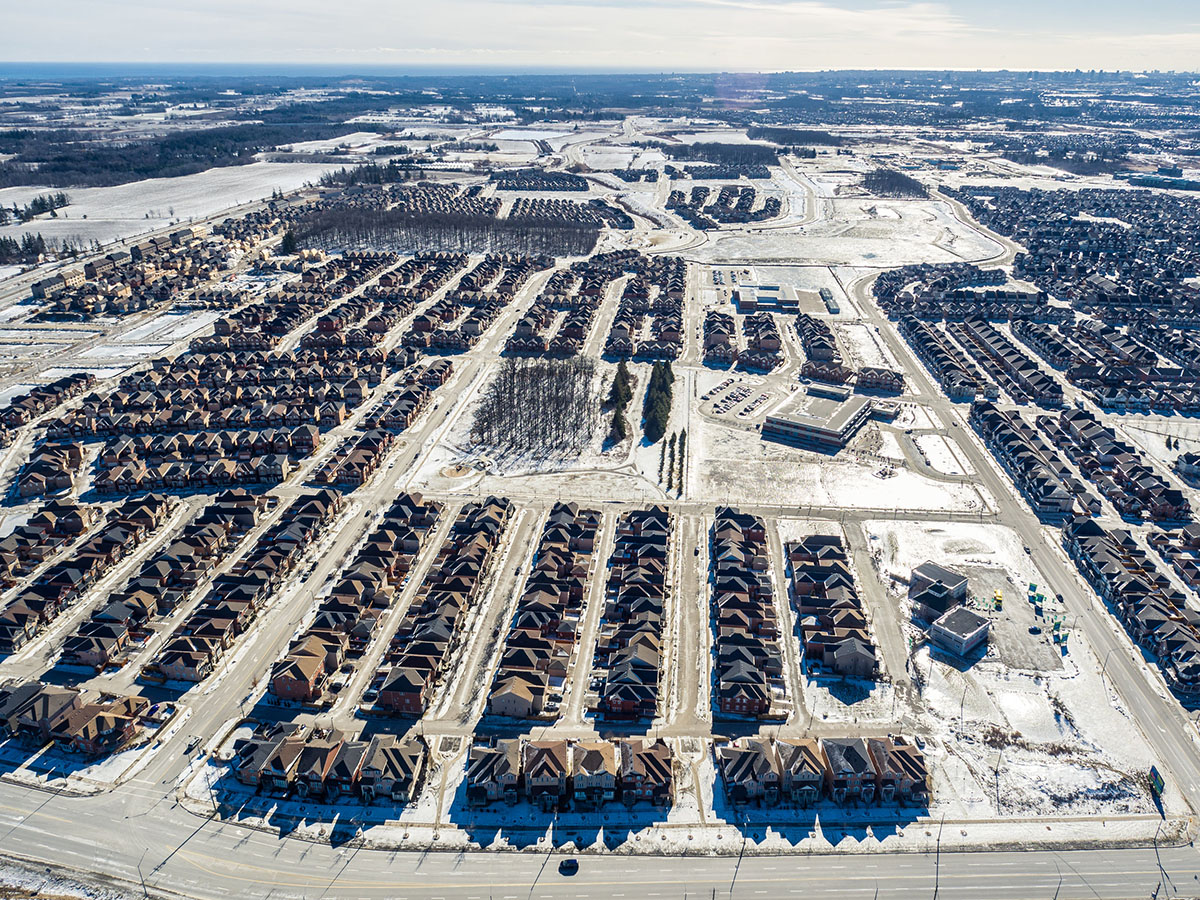 Cornell Community in Markham. Image © CUI.
Barrel Yards, Waterloo
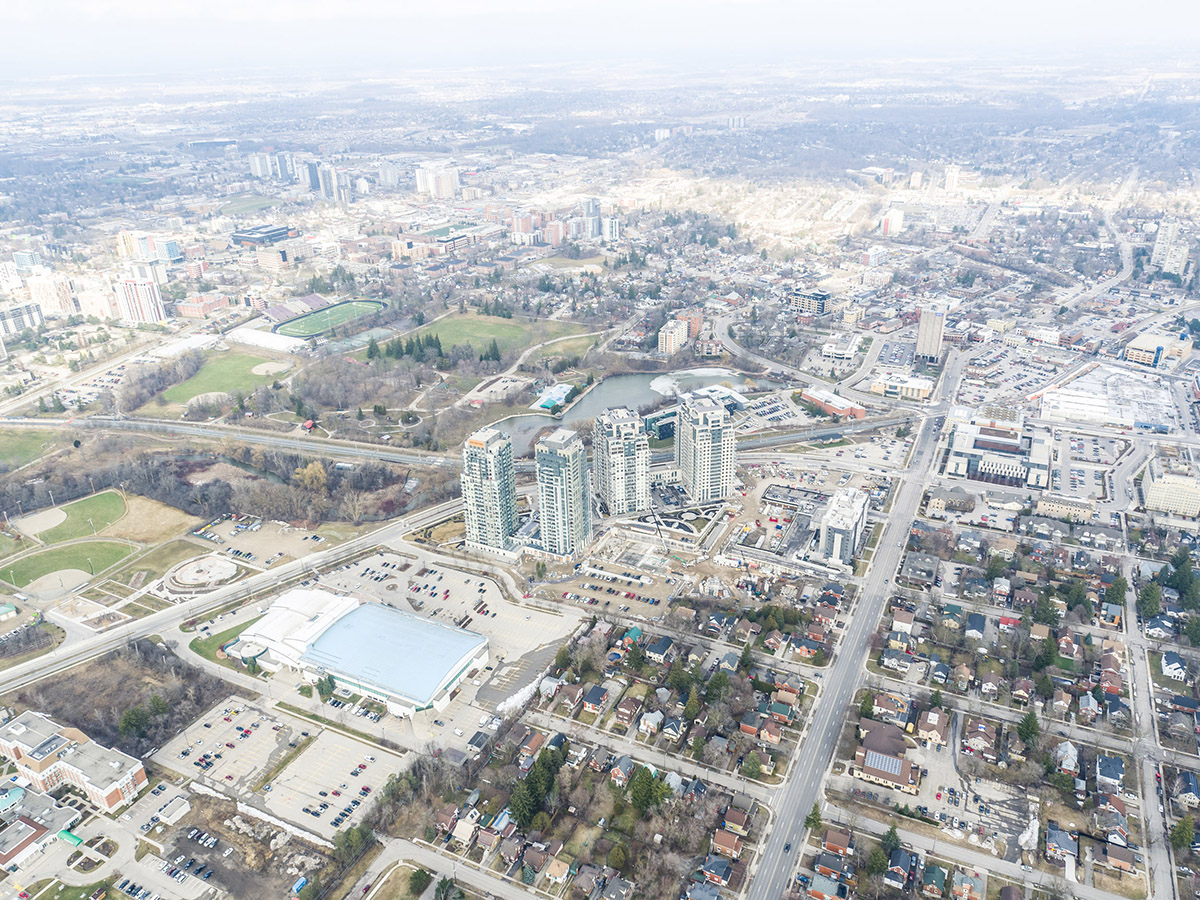 Barrel Yards in the University City of Waterloo. Image © CUI.
These case studies were conducted as per the suggestions offered by the expert panel and CUI’s careful selections of desirable places that also happen to be complete communities. A range of built forms and neighbourhood types were represented in the areas across the GGH that were ultimately chosen. The findings are discussed in detail in this piece.
Measures and Drivers of Complete Communities
The fact that increased density alone does not make for a great neighbourhood has already been established. Six ‘Drivers of Complete Communities’, associated with density, were determined, to create vibrant, inclusive, desirable places, for people to live and work.
Several measures were chosen for each driver, so as to understand their sheer relevance in a community. These measures and drivers were then used as a basis for the 5 case studies, which will be discussed in great detail.
To get a clearer understanding of what the drivers and the affiliated measures are, they have been laid out here separately.
Density
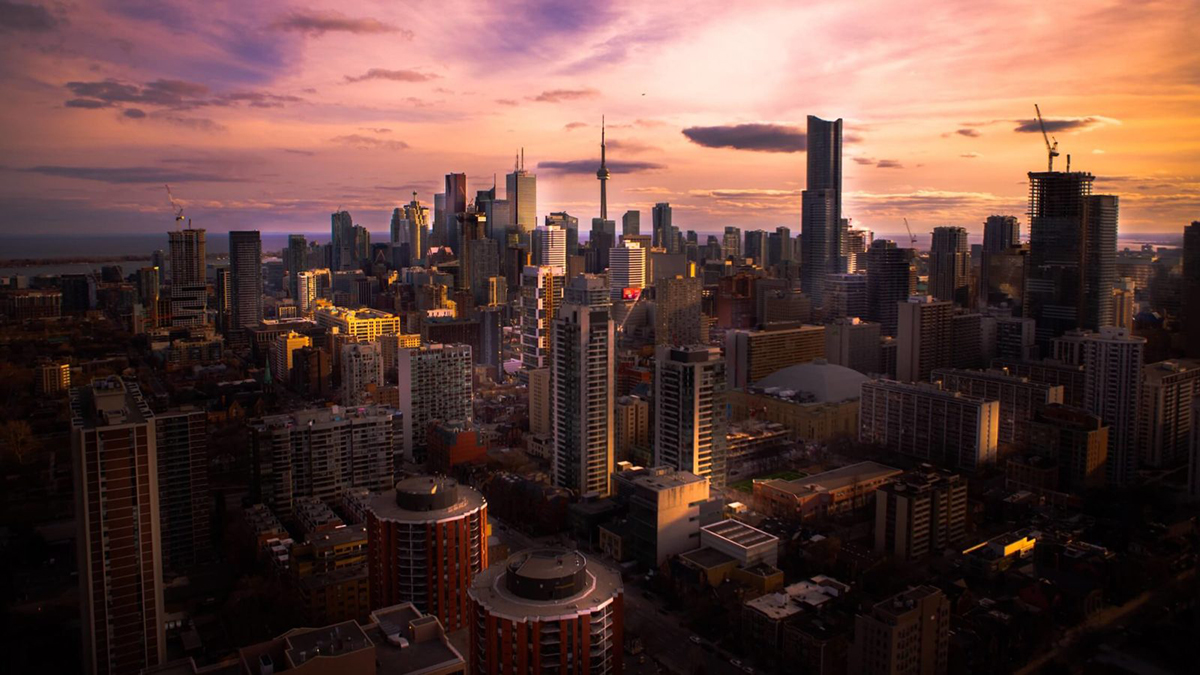 Downtown Toronto. Image © Azure Magazine.
Density, a concept borrowed from physics, is a measure that calculates the number of people living and working in a certain area. The province utilizes density targets as a metric to analyze the way in which municipalities and regions in the GGH are planning on achieving the goals attributed to the Growth Plan.
Measures:
Population by area (area in hectares)
Number of jobs by area
Numbers of people and jobs by area
Walkability
 Walkability Icon developed by CUI. Graphic © CUI.
Pedestrian circulation can be optimized by smart street and streetscape design, such as adopting grid networks and pedestrian pathways as opposed to existing cul-de-sacs. 400 metres is a walkable distance that is considered ‘reasonable’ as per many studies. Walkable neighbourhoods that are well connected are significant to engendering healthy economies. A city’s walkability, as per an application, Walk Score, is established by exploring the number of errands that can be completed without a car5. This brings us to the importance of the phenomenon of connectivity (between destinations like parks, shopping areas and schools that are walkable).
Measures:
Walking distances to destinations
Street connectivity and granularity
Sidewalks
Diversity
 Diversity Icon developed by CUI. Graphic © CUI.
A range of building types will aid in ensuring that a neighbourhood is in a position to accommodate residents representative of different demographic groups, and hence can support longevity and sustainable living. Policy and zoning regulations that advocate for infill owe to neighbourhoods that can leverage on development potential and evolve over time with relative ease.
Measures:
Diverse range of building types
Supportive policy and zoning
Development potential
Green and Open Spaces
 Green and Open Spaces Icon developed by CUI. Graphic © CUI.
Access to green and open spaces (parks, playgrounds or trails) certainly impacts neighbourhood liveability. Canadian cities have an average green space provision rate of 9.2 hectares per 1000 persons.
Measures:
Park space (in hectares)
Supportive policy and zoning
Development potential
Amenities
 Amenities Icon developed by CUI. Graphic © CUI.
Amenities are largely features that cater to the numerous needs of the community, largely comprised of retail services, recreational spaces, community centres, educational institutions and childcare services. The number of amenities, their accessibility and distribution, does influence how and why people choose a specific place to live.
Measures:
Retail and services
Community facilities
Number of jobs
Transit
![]() Transit Icon developed by CUI. Graphic © CUI.
Transit Icon developed by CUI. Graphic © CUI.
Different modes of transportation and the accessibility to transit are critical to sustainable and healthy communities. Apart from transit being a public good, it improves the social and economic climate, breaks physical and cultural barriers and, most importantly, reduces pollution. Some sources suggest that 50 people and jobs per hectare attributes to ‘transit-supportive density, while some others suggest a much higher statistic.
Measures:
Number of transit stops
Technology
Design
 Design Icon developed by CUI. Graphic © CUI.
Access to affordable housing along with a diverse range of housing options, environmental sustainability, public realm, safety and inclusivity, multi-modal transportation options and the general look and feel of a community, have a lasting effect on the liveability and vibrancy of a place.
Measures:
Scale, height and character of buildings
Attractive and vibrant public realm
Area of parking lots
For more details on the project, please visit their submission on CUI’s platform, please contact Canadian Urban Institute.
References:
Visualizing Density. Canadian Urban Institute with support from the Ontario Growth Secretariat
1. IBI Group. Urban Travel and Sustainable Development: The Canadian Experience (Ottawa: CMHC, 1993); P. Blais. Inching Toward Sustainability: The Evolving Urban Structure of the GTA (Toronto: Neptis Foundation, 2000) 37.
2. Next City. Housing in Brief: California's Density Bill Is Back! (https://nextcity.org/daily/entry/housing-in-brief-californias-density-bill-is-ba-a-a-ck)
3. Towards Defining perceived Urban Density. Emo, Beatrix, et al.
4. Visualizing Density. Canadian Urban Institute with support from the Ontario Growth Secretariat
5. Vox. Why walkable cities are good for the economy, according to a city planner. Aditi Shrikant.
Top Cover Image: Canadian Urban Institute’s Visualizing Density Project. Image © CUI.